Global seismicity
These set of examples show how to plot the global seismicity in Julia using GMT.
The seismicity function downloads data from the USGS Earthquake Hazards Program page at USGS and makes global seismicity maps with nice automatic legends. By default, it plots the earthquakes served from that site for the last 30 days and it usage is simply:
using GMT
seismicity()
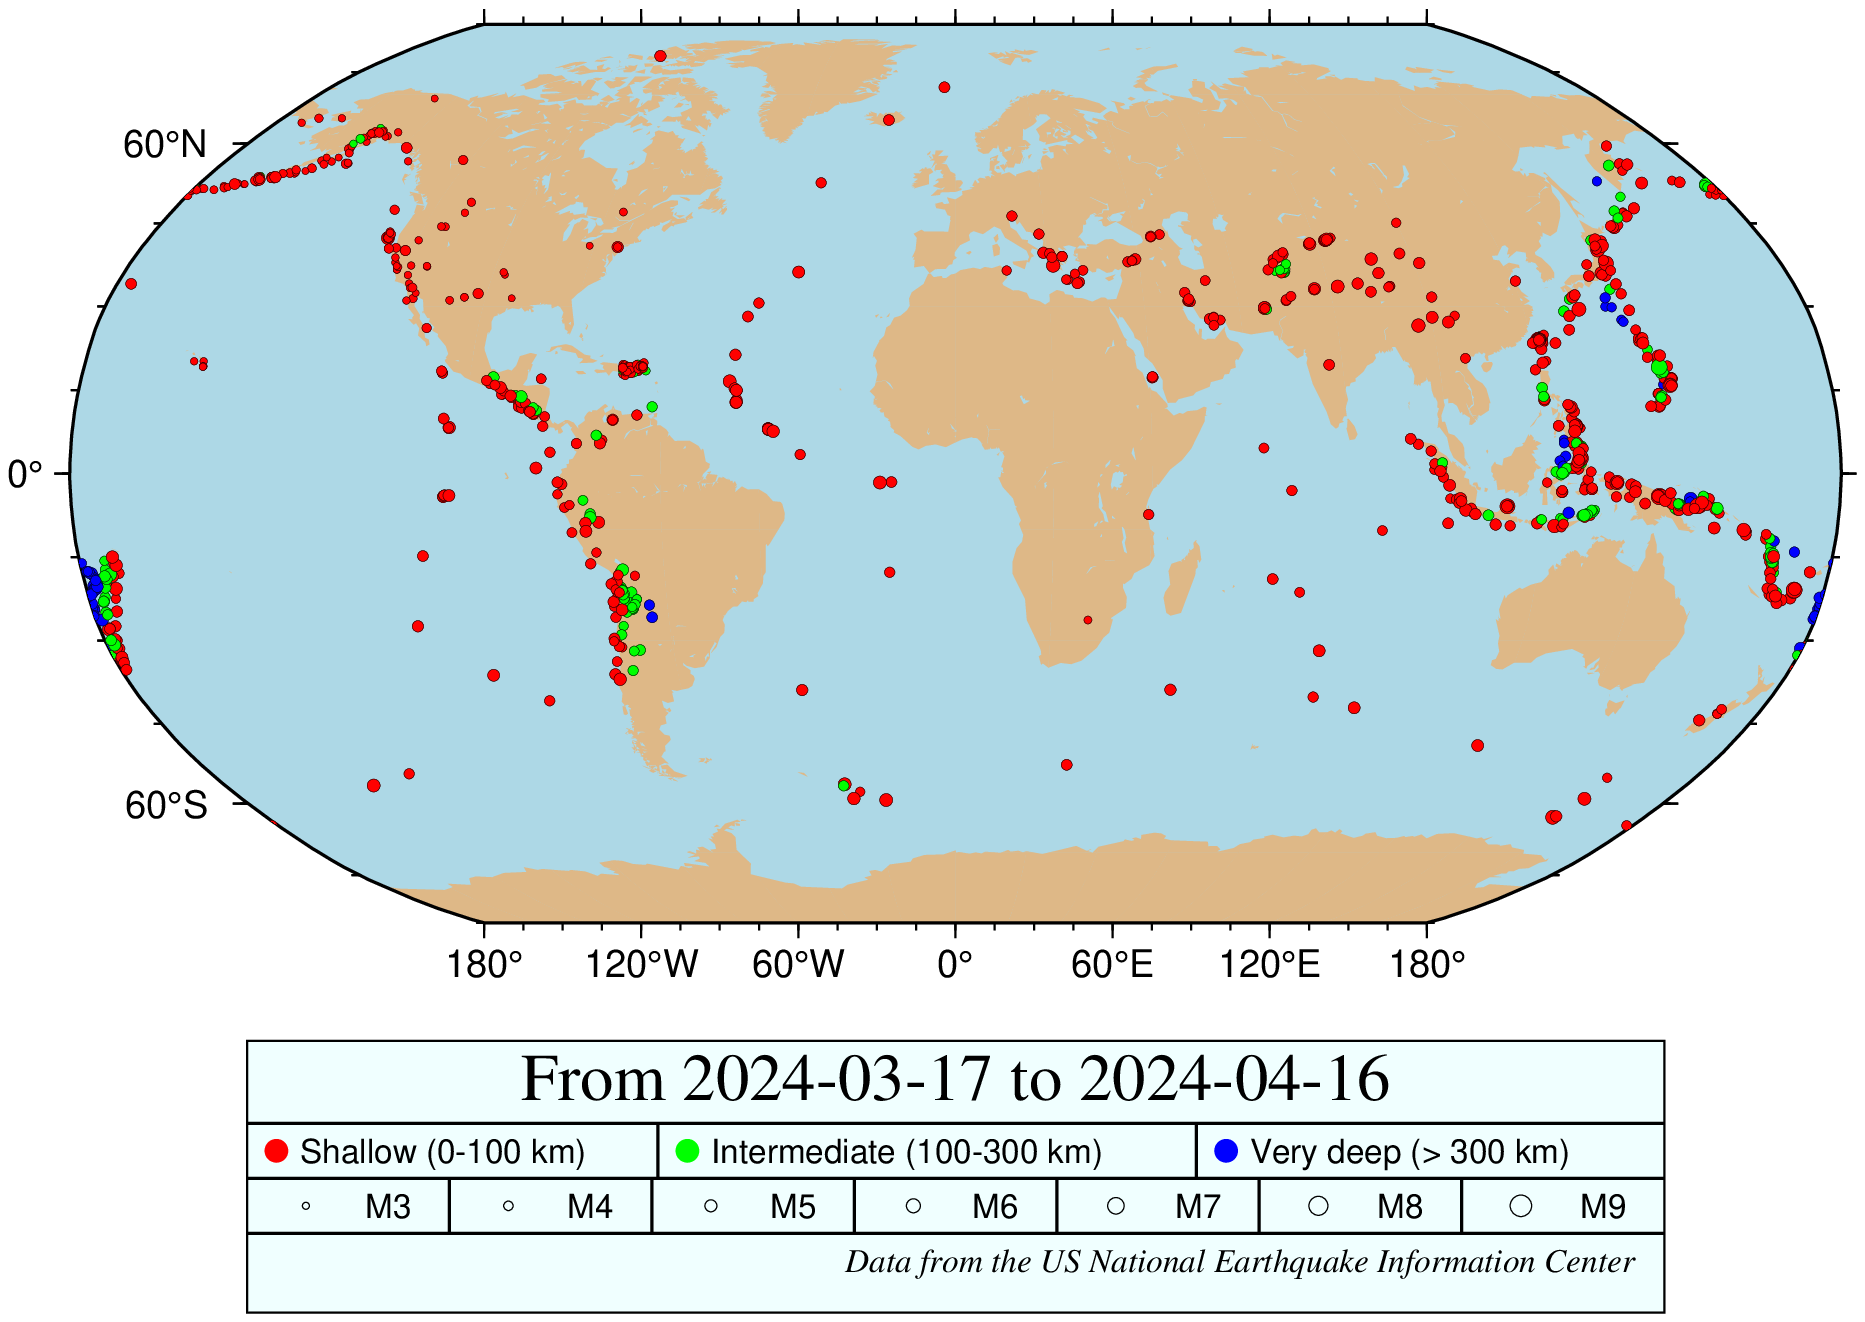
But we can select the period that we want under the condition that the request doesn't imply more than 20,000 events. For example, to plot the last year of seismicity:
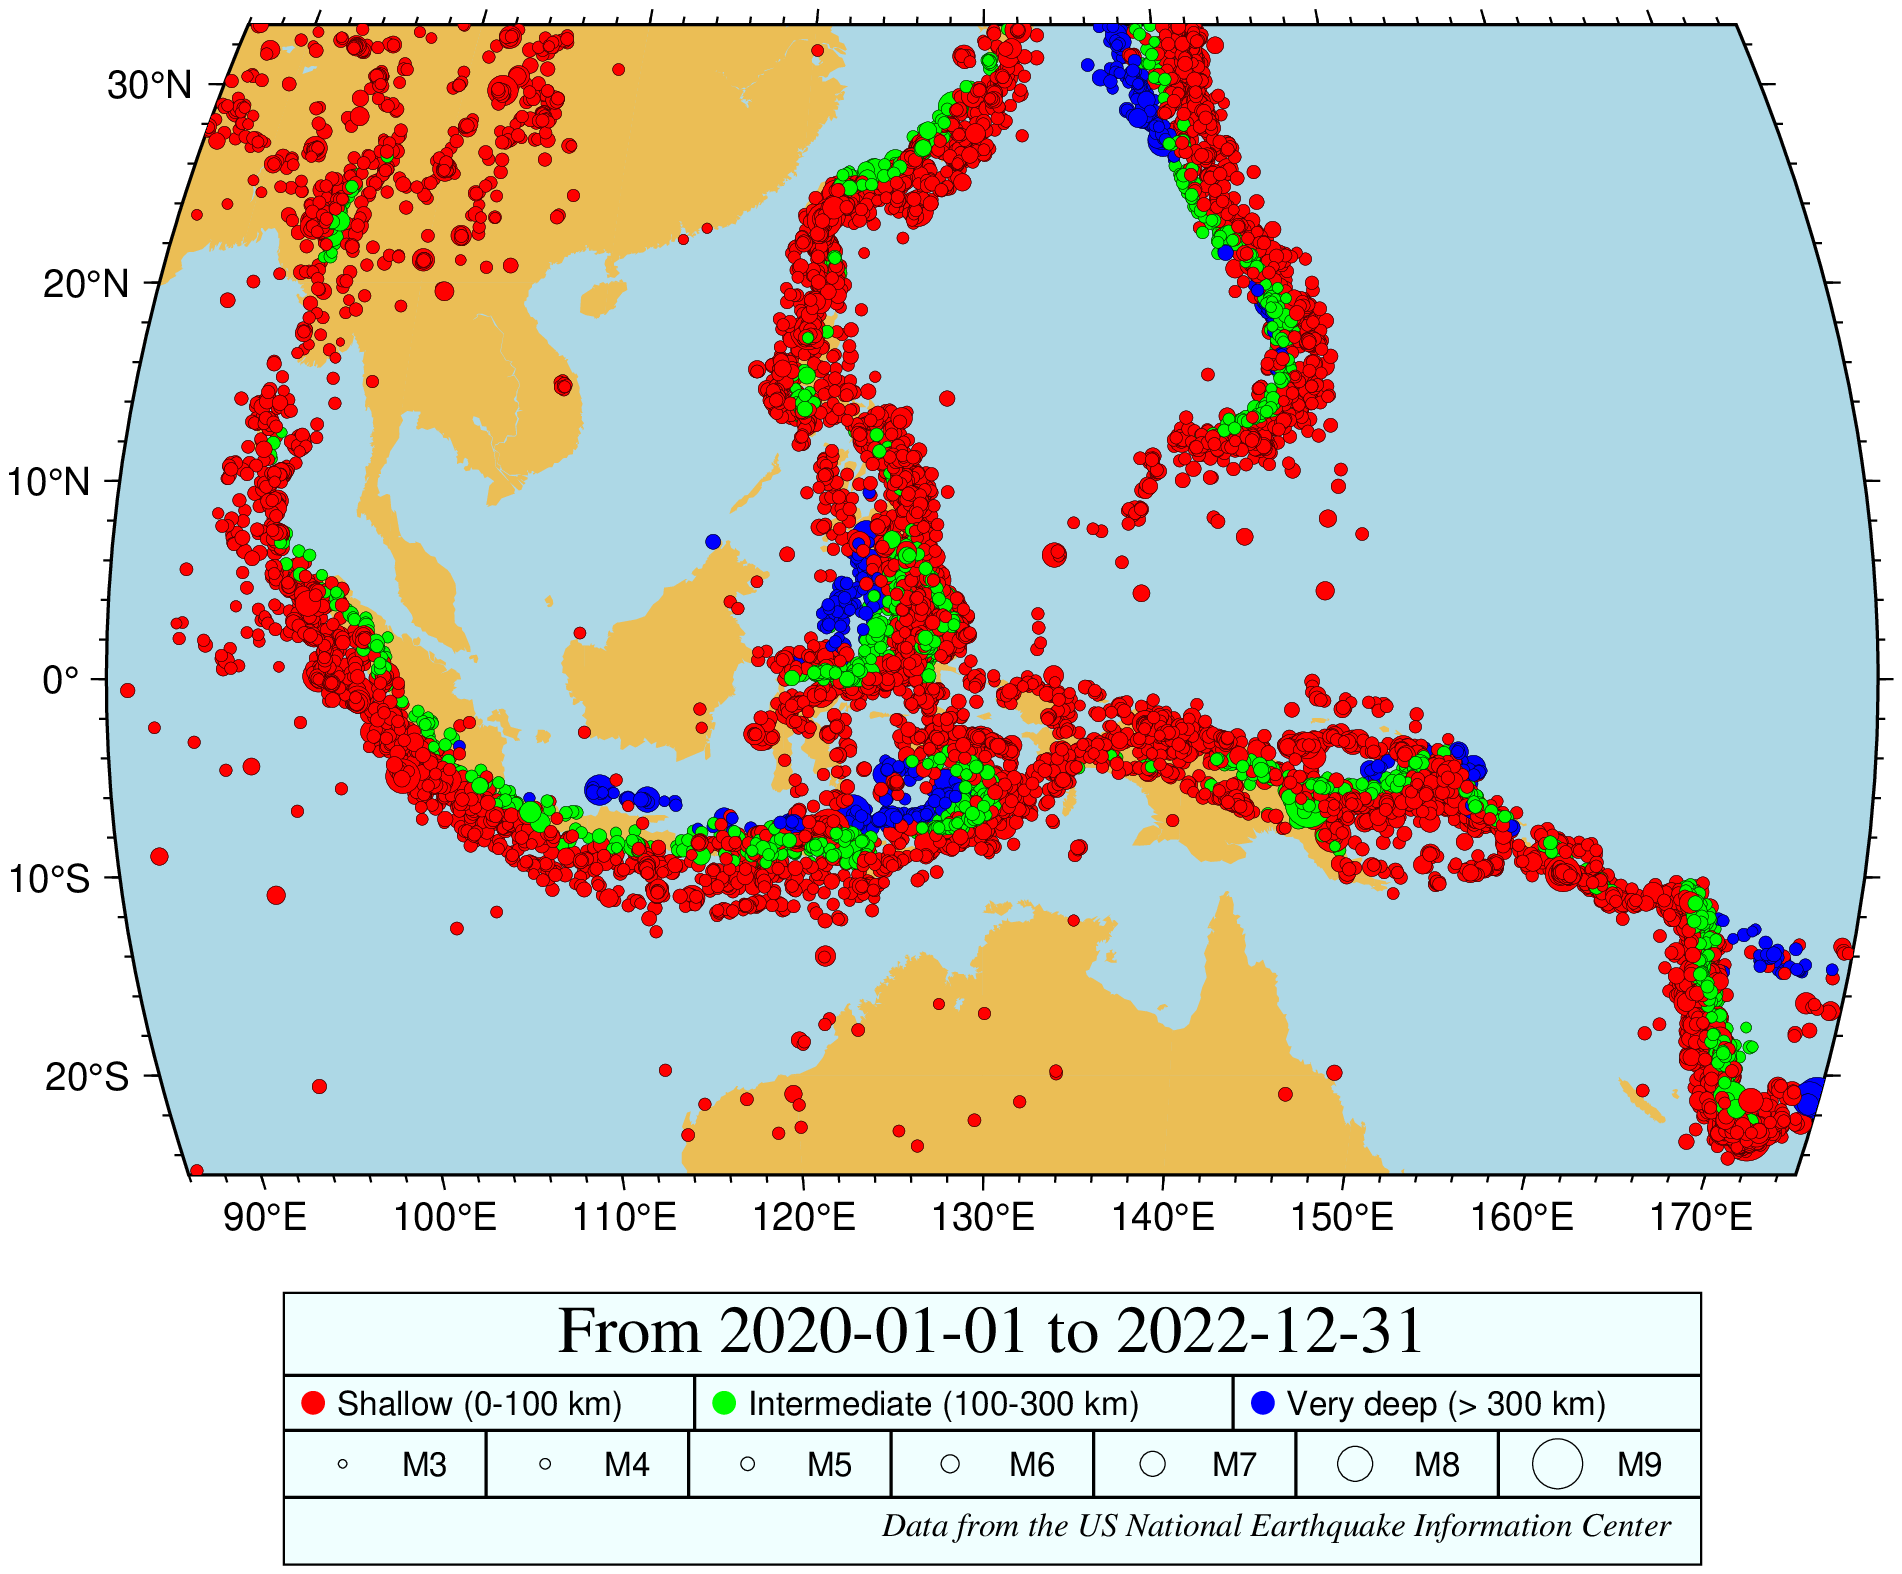
seismicity(last="1Y")In the examples above we used the default linear scale for the earthquake magnitudes. But we know that magnitudes follow a logarithmic scale. But the problem of applying an exponential function to the events sizes is that if we start with a certain size, large events are so much bigger than other that they risk to hide almost everything. To prevent that, we can specify the min and max symbol size and let the point sizes follow a certain expression. For example, next example shows events size from 2 to 12 points for earthquakes with magnitudes between 3 and 9. We take the opportunity to also show the effect of a couple of other options, namely defining a region, a fixed period and selecting non-default continent and ocean colors.
seismicity(region="86/175/-25/33", size=(exp, [2 12], [3 9]), land=:lightbrown,
           ocean=:lightblue, starttime="2020-01-01", endtime="2022-12-31")
These docs were autogenerated using GMT: v1.33.1